That might strike you as a strange question, but it’s a very real one at the heart of the debate on the Government’s proposed targets for swimmable rivers and lakes in its Clean Water 2017 package.
The proposal has generated significant controversy since its release, with clean water campaigners saying the Government has shifted the goal posts by weakening the definition of ‘swimmable’. Environment Minister Nick Smith fired back saying these claims were rooted in “junk science” and to understand things properly we need to get “a bit nerdy”. Say no more – I decided to take a look.
Assessing the risk
The key metric used for determining how safe it is to swim is the level of E. coli (expressed as the number per 100 ml). This can be related to the risk of infection with a gastro bug like campylobacter. The graph below shows how this risk increases with the level of E. coli (note that the horizontal axis is not linear). At a level of 130 E. coli per 100 ml, we’d expect one in every 1000 people to get infected. The risk rises to one in every 100 people at 260 E. coli per 100 ml, and to one in every 20 people at 560 E. coli per 100 ml.
Source: Ministry for the Environment
Previously, the Government has established a level of 540 E. coli per 100 ml as the “minimum acceptable state” for full immersion activities like swimming. A key thing to recognise is that the E. coli level isn’t static – it fluctuates over time, especially when heavy rain washes more poo into the water. Under the existing regulations, a river is deemed suitable for swimming if the level is less than 540 E. coli per 100 ml at least 95% of the time (i.e. it exceeds that level at most 5% of the time). That gets a ‘B’ grade, and there is also a higher ‘A’ standard if the level only exceeds 260 E. coli per 100 ml at most 5% of the time.
The new swimmable definition
So what is the Government proposing? The key change is that it will allow a river to exceed the 540 E. coli per 100 ml limit more often and still be defined as swimmable.
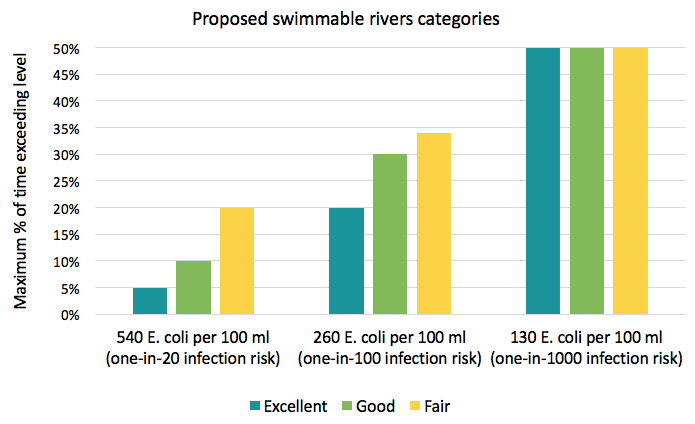
The new scheme would lump rivers into five categories based on several ‘attributes’. The top three categories (labelled ‘excellent’, ‘good’ and ‘fair’) all qualify as ‘swimmable’. For all three, the E. coli level must be less than 130 per 100 ml (i.e. an infection risk of less than one in 1000) at least half the time. But the categories differ in the percentage of time the level can exceed 540 E. coli per 100 ml: up to 5% for excellent, up to 10% for good, and up to 20% for fair.
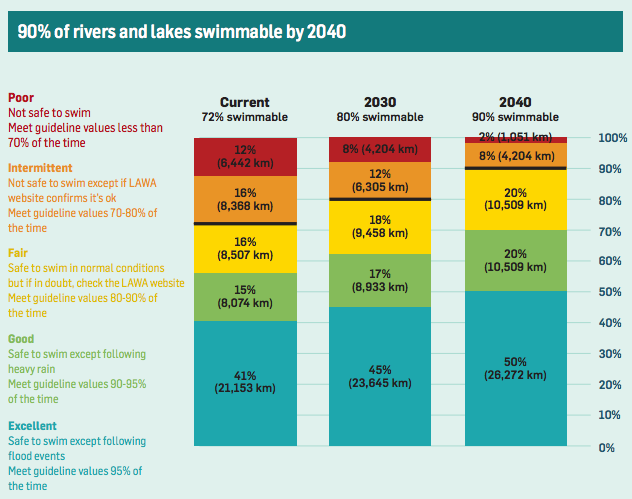
The Ministry for the Environment says that under these rules, 72% of New Zealand’s rivers (by length) would currently qualify as swimmable. The Government is proposing goals of increasing this to 80% by 2030 and 90% by 2040.
Source: Ministry for the Environment
There are a few good and sensible things in the Government’s proposals. Firstly, the time-based approach recognises that ‘swimmability’ is a dynamic rather than static quality. A river that exceeds the limit only after heavy rains should be safe to swim in the vast majority of the time (and people shouldn’t really be swimming at those times when the river is very swollen anyway). Secondly, this framework should drive a sensible focus on reducing the frequency that limits are exceeded. And thirdly, a critical point to note is that the Government is proposing more than just a ‘bottom line’ standard – its goals framework will require increases across all three swimmable categories, not just the total number. This will help to protect against decline in currently swimmable rivers, and require continued improvements above the minimum ‘fair’ category.
The problems
There are, however, many shortcomings with the Government’s proposed swimming goals. The beef (apologies) from campaigners which has attracted the most attention is that the previous top standard for swimmable rivers – 260 E. coli per 100 ml at least 95% of the time – has gone. Once a river reaches the new ‘excellent’ grade, there is no incentive to improve it any further. Worse, this could allow rivers that meet the current top standard to decline.
Basically, groups like Choose Clean Water want higher safety standards. They argue that an infection risk of up to 5% (one in 20) is too high, and we should be trying harder to limit exceedance of 260 E. coli per 100 ml (a one in 100 infection risk).
The Government’s proposed categories do actually include statistics on this. As the graph below shows, the 260 per 100 ml limit could be exceed up to 20%, up to 30% and up to 34% of the time under the excellent, good and fair categories respectively. In other words, in the top category, that limit would be exceeded up to one-fifth of the time.
Source: Graphed from MfE attributes table
How about some evidence?
Nick Smith has said that the Government intends for the classifications to be “fair and reasonable for an average person”, and that is the crux of the issue. Stepping back, the striking thing is the lack of evidence that would allow us to really address this question. It is clearly a question about values and cannot be answered by science alone. It will not be adequately answered through the usual submission process either, or through a fiery debate in the media. But nowhere in the Government’s proposals or supporting documents is there any research or evidence on New Zealanders’ actual values and attitudes towards safe swimming – what they find acceptable or what they value in their water quality.
If the Government is serious about setting “fair and reasonable” standards for swimmable rivers and lakes, perhaps they should commission some independent research to find out what the New Zealand public actually thinks is fair and reasonable. We might ask questions such as: What is an acceptable level of risk for them to go swimming? Under what conditions is it OK for risk limits to be exceeded? Would they accept needing to check whether a swimming spot is safe each time they want to swim? Do they think all rivers and lakes should be swimmable, or would they accept some being off limits? What are their aspirations for the state of our rivers and lakes in 2050? How do these aspirations compare to how things were 30 years ago?
In the absence of any of that research, we’re curious to know what you think. How much risk would you be willing to take for a swim in a river?


