
It’s been a sweltering Kiwi summer, and analysis released last week shows we aren’t the only ones feeling the heat. First NASA and then NOAA (the US National Oceanic and Atmospheric Administration) released their latest global temperature data showing that 2016 is so far blowing previous temperature records to smithereens. The strong El Niño we are experiencing, on top of the unrelenting warming trend caused by our greenhouse gas emissions, has put us in truly unchartered territory.
How hot is it?
According to NOAA, this February was 1.21°C hotter than the 20th century global average. But hang on, when we’re talking about climate change we usually put temperatures relative to the pre-industrial level – that’s what the globally-agreed two degree limit is defined against. Converting NOAA’s data to the pre-industrial base (using the 1880-1900 average), we find that February was a whopping 1.46°C hotter. This graph shows just how hot that is.
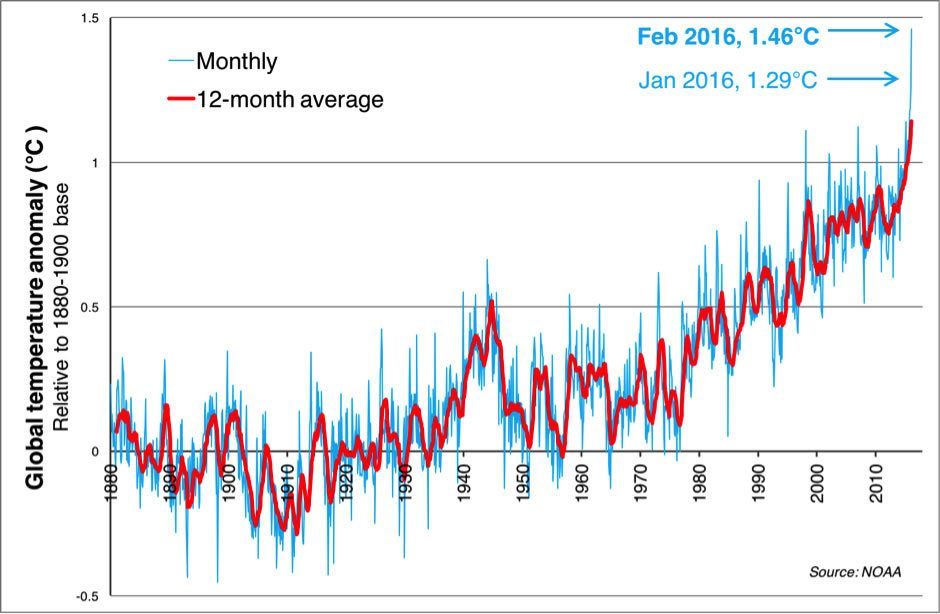
Already, every month since October 2015 had set a successive new record, before February came along and hit it right out of the park.
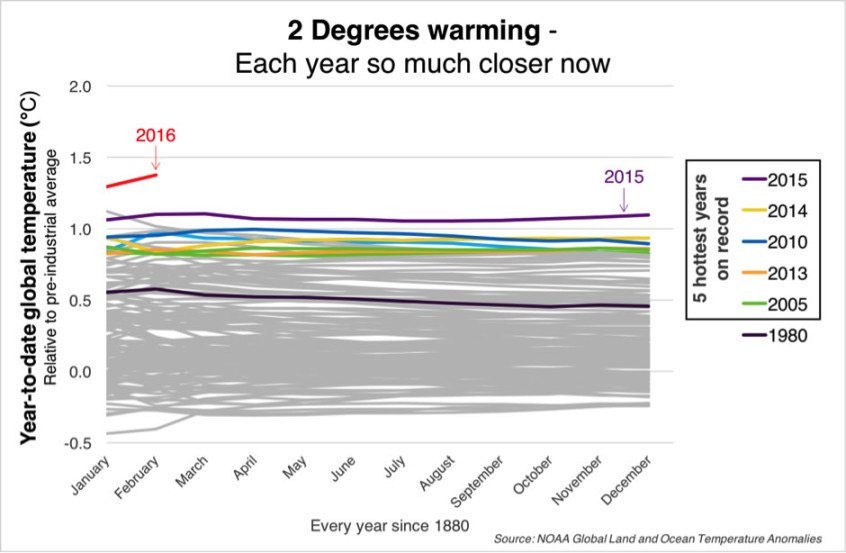
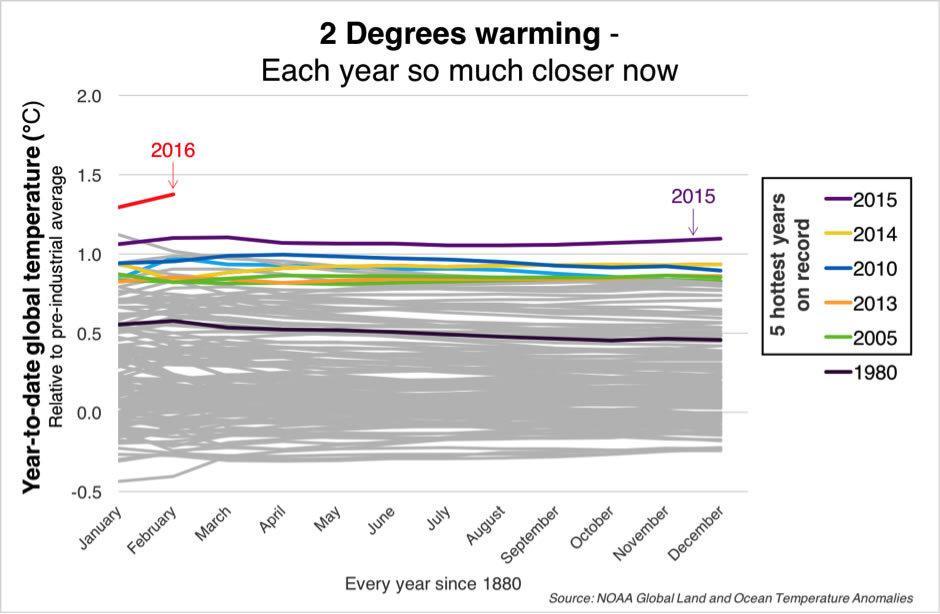
We already knew that 2015 was the hottest year on record and scientists were picking 2016 to break that record, but the size of this heat spike has been a shock. So far, as the next graph below shows, 2016 is in a league of its own. We’d expect temperatures to drop with the El Niño subsiding, but right now 2016 looks set to smash last year’s record by some margin.
According to NASA, the February heat spike was even higher – an unbelievable 1.63°C above the pre-industrial average. If they are right, the aspirational 1.5 degree target agreed upon in Paris has been breached for the first time.
One of the reasons the two data sets differ is different levels of global coverage – NOAA’s analysis covers 93% of the planet, while NASA’s covers 99%. In particular, NASA ‘interpolates’ (estimates missing data points) to give better coverage of the poles, where there aren’t many weather stations. NOAA largely misses these regions out.
The February results make sense because the most extreme temperatures are being experienced in the Arctic, as shown in NASA’s map below. In February, areas in the Arctic were as much as 11 degrees hotter than the historical average. The Guardian reported that the warming has “robbed the Arctic of its winter”.
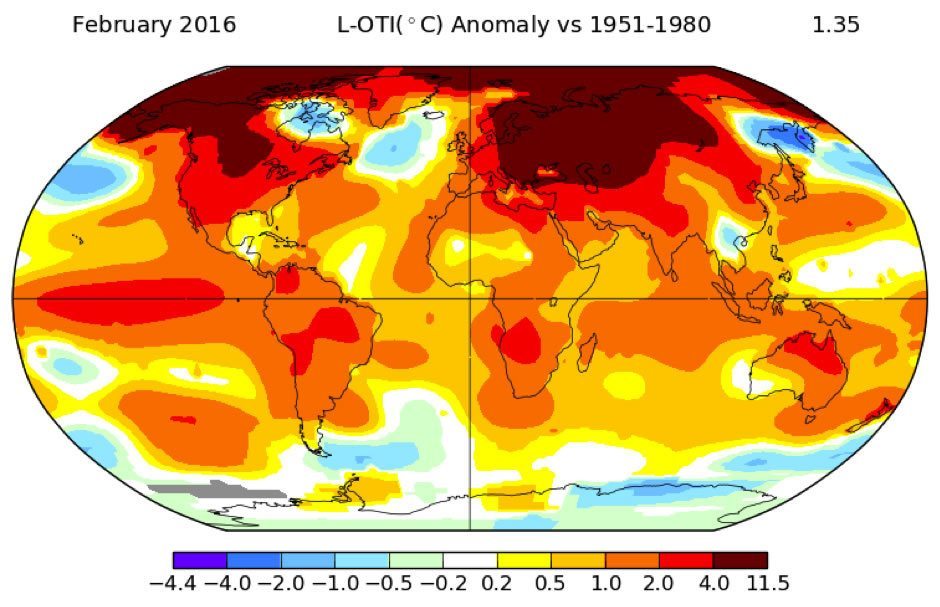
(Source: NASA/GISS)
If you look closely you can also see a little hot spot over New Zealand. Sure enough, NIWA says it was New Zealand’s second hottest February on record, second only to 1998 (the last time a strong El Niño was at play).
What’s driving it?
El Niño is part of a recurring climate pattern called the El Niño Southern Oscillation (ENSO), which is linked to sea surface temperatures in the Pacific ocean. You’ve probably also heard of its opposite phase, La Niña. El Niño events happen when the surface water in the eastern and central tropical Pacific warms (see the big red blob in the map above), triggering a range of knock-on effects on global weather. Global air temperatures run hot as the oceans give up heat to the atmosphere. The last strong El Niño in 1997-98 also caused a big spike, as you can see on the first graph.
But those temperature spikes and falls are happening over the ongoing global warming trend. The fact that temperatures this February were 0.35°C hotter than the peak in 1998 (according to NOAA) just goes to show how much we have heated up the planet over the 18 years in between.
No doubt climate change deniers will use this year’s result to claim there is a hiatus in warming for years to come – as they have done since the last big spike in 1998. However, to anyone with a remote interest in the truth, the long term trend is clear.
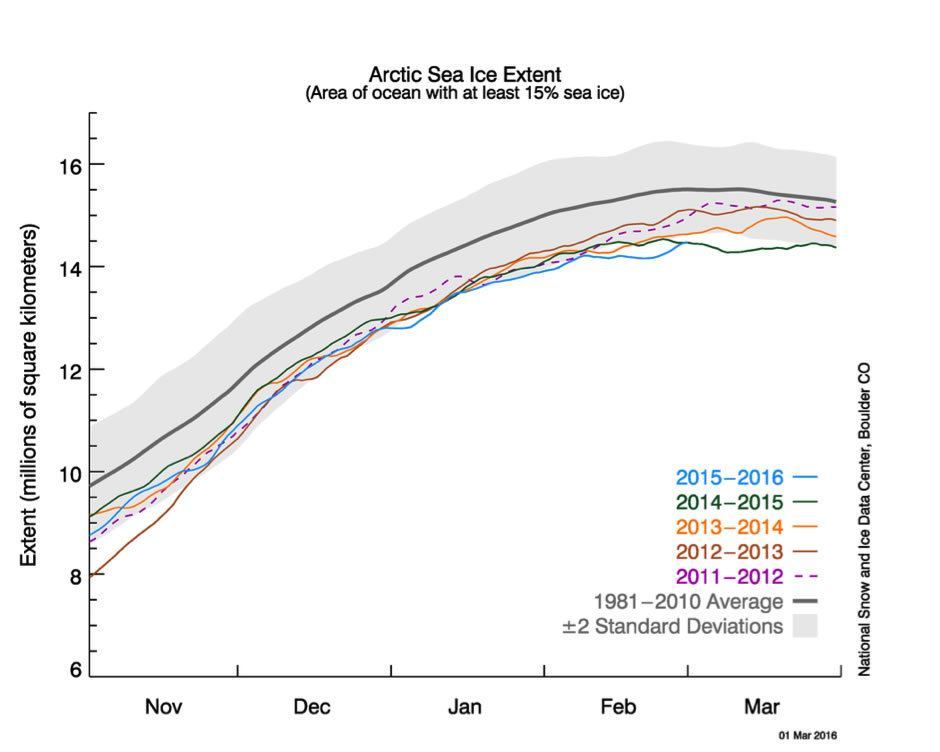
The scary thing is that, as we’ve discussed, NOAA’s analysis misses out much of the Arctic, which is experiencing the most extreme warming. That means it’s most likely understating the current temperature spike. What we’re seeing in the Arctic is a feedback loop: the reduction in sea ice area caused by warmer temperatures leads to further warming because (1) less sunlight is reflected and more is absorbed in the Arctic summer, and (2) sea ice acts as an insulator between the relatively warmer water and colder air in the Arctic winter. As the graph below shows, Arctic sea ice extent has been at a record low for the first two months of this year.
What effects is it having?
Over the last few months we’ve seen the expected impacts of an El Niño, with human-induced warming throwing more fuel on the fire (in some cases, literally).
Rainforest fires burned in Indonesia through the second half of 2015, exacerbated by the dryness that El Niño brings to the region. This likely contributed to 2015 registering the largest annual increase in atmospheric CO2 concentration on record – another feedback loop where natural processes amplify the warming we are causing.
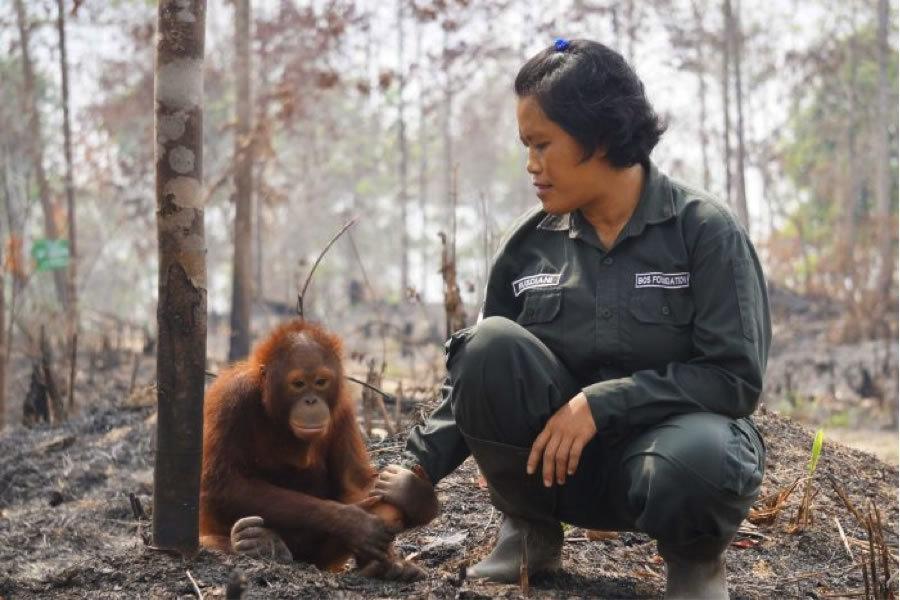
Photo: Tony Gilding via ABC News
In February, Fiji bore the brunt of the strongest ever cyclone recorded in the Southern Hemisphere, Cyclone Winston. This killed 44 people and caused enormous damage amounting to some $470 million USD in economic losses (roughly 10% of Fiji’s GDP). Meanwhile other Pacific Islands experienced devastating drought conditions due to record or near-record dryness. The Marshall Islands government was forced to issue a state of disaster.
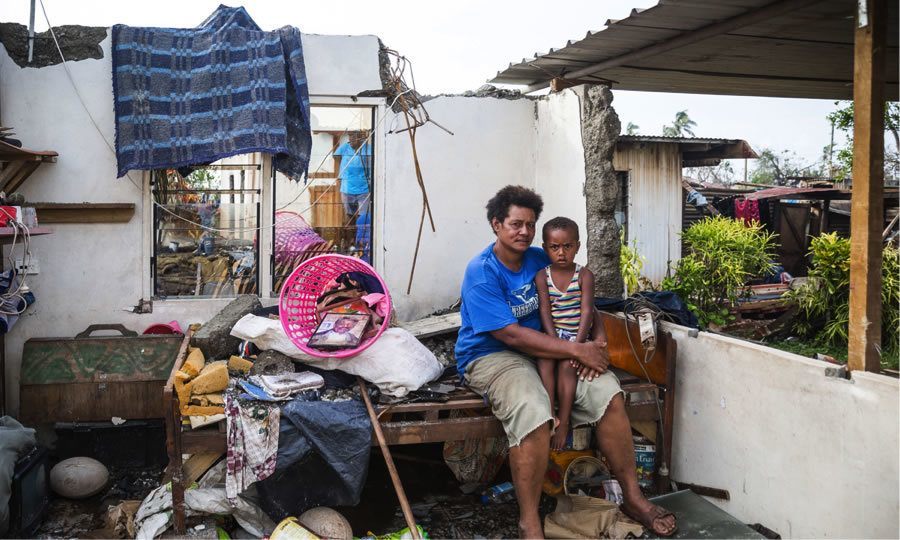
Photo: UNICEF/Sokhin
In October, NOAA declared the third ever global coral bleaching event – the previous ones were in 1998 and 2010. This one has now been confirmed as the longest recorded. Corals are very sensitive to ocean warming – they are often referred to as the canary in the coal mine when it comes to climate change. Bleaching happens when corals expel the symbiotic algae living in their tissues, most commonly due to temperature changes. Prolonged bleaching events can lead to coral death. This matters, because coral reefs help support approximately 25% of all marine species and the livelihoods of hundreds of millions of people.
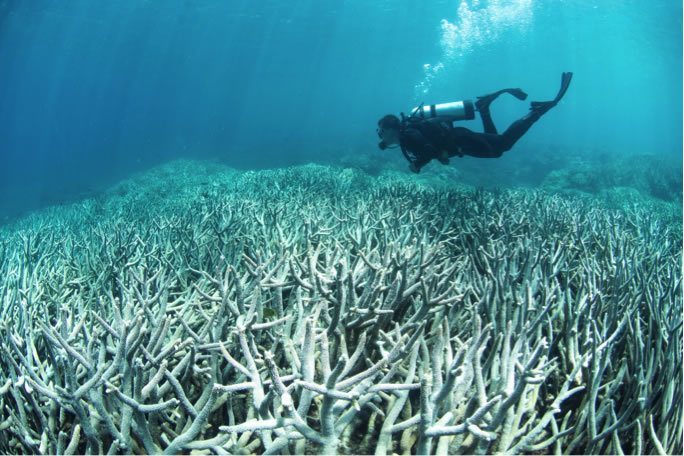
Photo: Heron Island, Great Barrier Reef, www.globalcoralbleaching.org
Here in New Zealand we have thankfully been spared this time from a similar drought to what occurred in the 1997/98 summer, which would have lumped more stress on an already struggling farming sector.
A new era, or climate change as usual?
This massive heat spike has taken many by surprise with its scale. Really though, this is global warming proceeding pretty much as predicted. That is what we need to collectively get our heads around, and act accordingly.
Natural variability will always cause spikes and dips on the warming trend, which means we could see some years breaching the two degree threshold within just a few decades. Also, given how chaotic and non-linear the climate system is, we should expect the unexpected. Temperatures should drop back in coming months as the El Niño recedes, but each time we break through previous records we are pushing the planet into a state humans have never experienced, and we can’t know exactly what the consequences will be.
The aspirational goal declared in Paris just before Christmas, however – that policy should aim to keep the average temperature rise below 1.5 degrees – is increasingly looking like a pipe dream. As renowned climate scientist Stefan Rahmstorf put it in a widely-reported quote, “we are in a kind of climate emergency now” – but he wasn’t referring to just the last few months. “It is becoming more and more urgent. Time has almost run out to get emissions down. That’s the real emergency.”